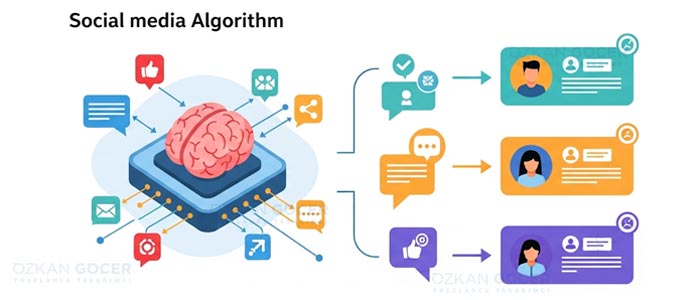
Impressions can rise while enquiries fall. That is not necessarily a contradiction: being seen, attracting a relevant visitor and receiving a suitable enquiry are different outcomes. A useful report makes the gap visible and identifies what to investigate.
State the Objective, Period and Scope
Put the accounts, date range, time zone, objective, comparison period and extraction time at the top. When comparing calendar months, note different numbers of days, holidays and campaign changes. If a new account has no previous period, label the first report as a baseline.
The priority metric depends on the goal. A workshop may need suitable class enquiries; a support account may need resolved questions; an awareness campaign may need reach among a relevant audience. Supporting metrics help investigate changes in that result. If the objective is unclear, first establish the goals and responsibilities of social media management.
Label organic posts, paid promotion and creator partnerships separately. A post that was later boosted is not directly comparable with its earlier organic performance. Identify incomplete data instead of presenting it as a finished reporting period.
Where Should the Data Come From?
Scroll sideways to read every column. Keyboard: focus the table and use the arrow keys.
| Source | Example Data | What It Describes | What It Cannot Prove Alone |
|---|---|---|---|
| Platform analytics | Reach, views, interactions, link clicks | Distribution and responses within the platform | Website visits or sales |
| GA4 | Sessions, source/medium, selected key events | Measurable website visits and events | That every click or sale was recorded |
| Order or enquiry records | Valid enquiries, sales, returns | Business-confirmed outcomes | That social media alone caused the outcome |
Reach usually describes unique accounts within a defined scope. Impressions or views describe display or viewing events according to the platform's definition. A view is not necessarily the same event on every network. Buffer's metric documentation shows differences in available data and calculation scope. Keep the platform's definition alongside the number you export.
The same person may see several posts or two of your accounts. Do not add post reach figures and label the result “total unique people reached.” Public competitor likes and comments do not reveal their reach, costs or sales either. Keep competitor topic and format observations separate from measured business performance.
Calculate Engagement Rate with a Named Denominator
Define what counts as an interaction first. If you use likes, comments, saves and shares, say so. Then calculate total interactions ÷ chosen denominator × 100. The denominator might be reach, impressions or followers; those rates are not interchangeable.
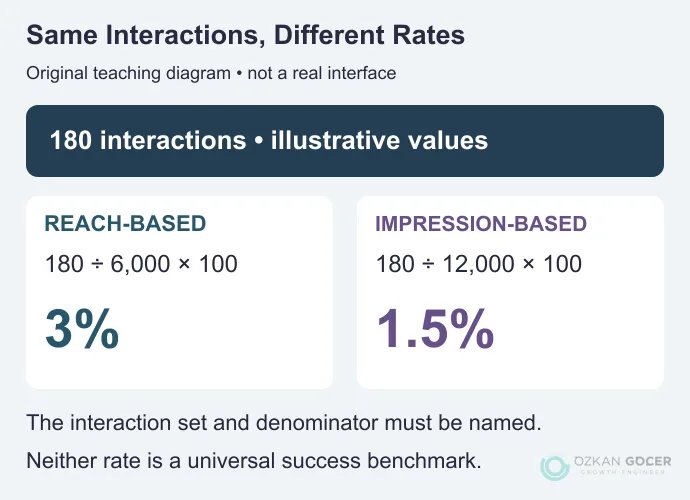
For an illustrative post with 180 interactions, a reach of 6,000 and 12,000 impressions, the reach-based rate is 3% and the impression-based rate is 1.5%. Neither calculation is inherently wrong. They answer different questions, which a column labelled only “engagement rate” would conceal. Choosing the same denominator does not automatically align different platforms' definitions of an interaction.
The simple average of individual post rates may differ from total interactions divided by total impressions. State which method you use. If the previous value was zero, do not calculate percentage change; write “increased from 0 to 7.” An increase from 2% to 3% is one percentage point, or a 50% relative increase.
Build and Check a UTM-Tagged Link
UTM parameters label campaign links shared outside your website. Google's campaign URL documentation explains source, medium and campaign fields. For an organic Instagram bio link, a naming dictionary could look like this:
Scroll sideways to read every column. Keyboard: focus the table and use the arrow keys.
| Field | Example Value | Meaning |
|---|---|---|
utm_source | instagram | Where the link was shared |
utm_medium | social | Organic social sharing in this example |
utm_campaign | atolye_ekim | A shared campaign name, meaning October workshop |
utm_content | bio | Link placement or content variant |
Enter the destination and those values in Campaign URL Builder to generate a tagged URL. The tool does not validate your naming decisions, so avoid inconsistent spellings within a campaign. Never put personal information in the parameters.
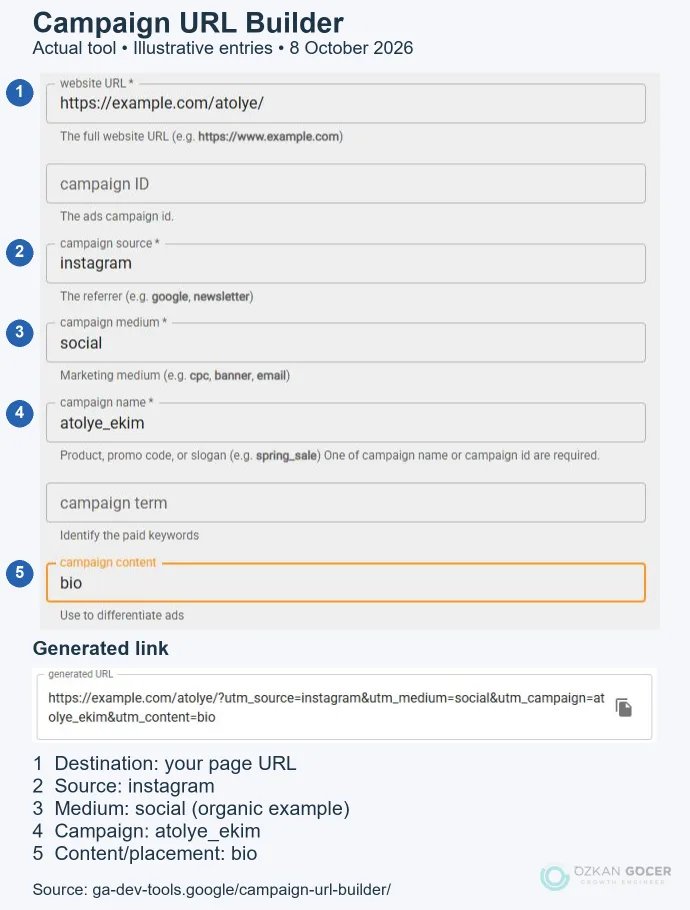
The screenshot shows the actual tool with an illustrative example.com destination and campaign name. Before publishing a link, open it and check the destination and whether redirects preserve the tags. Verify collection using an appropriate test for your measurement setup. Adding a UTM does not install GA4 or create an enquiry event.
Untagged social traffic does not always become Direct. GA4's channel rules also use the source, so a recognised social referrer may be classified correctly. Losing source information makes attribution harder. Video sources such as YouTube or TikTok may appear under Organic Video, so checking only Organic Social can miss relevant traffic.
Read Sessions and Enquiries Separately in GA4
In the Traffic acquisition report, set the period and use Session source/medium to find the relevant source. Navigation can vary by property. Use the report's available dimensions to examine a campaign or content variant rather than assuming every field appears in the default table.
User acquisition and Traffic acquisition have different scopes. The former concerns new users' initial acquisition; the latter concerns sessions. Do not use first-user source for one month and session source for the next under the same comparison heading.
A platform click does not have to equal a GA4 session. Repeated clicks within a session, an unloaded page or missing measurement can contribute to differences. Google's explanation of clicks versus sessions specifically concerns Google Ads, but illustrates why the units should not be treated as identical. Investigate the actual cause in your own social traffic setup.
For enquiries, check whether you record a button click or a successfully submitted form. A marked key event is not necessarily a business-qualified lead. Test a sample submission and distinguish duplicates, spam and unsuitable enquiries in your business records. Report aggregate outcomes rather than exposing personal enquiry details.
A Social Media Report Example You Can Adapt
The following figures are fictional teaching values, not account or client results. Imagine a workshop comparing two equal-length periods. Its goal is suitable enquiries, and the scope is one social account plus website traffic tracked for that campaign.
Scroll sideways to read every column. Keyboard: focus the table and use the arrow keys.
| Metric and Source | Previous | Current | Change |
|---|---|---|---|
| Impressions, platform | 12,000 | 18,000 | Up 50% |
| Reach, platform | 8,000 | 9,000 | Up 12.5% |
| Link clicks, platform | 120 | 150 | Up 25% |
| Sessions, GA4 campaign filter | 90 | 105 | Up about 16.7% |
| Qualified enquiries, business records | 9 | 7 | Down about 22.2% |
Executive summary: Visibility and clicks increased, but qualified enquiries fell from nine to seven. The available data does not show an improvement in the business objective. The sample is also too small to establish a firm trend or cause on its own.
Checks: Did enquiry tracking or the qualification definition change? Did the booking page's price, dates or capacity change? Are the new posts attracting people outside the service area? These are questions to investigate, not answers proved by the table.
Action record: The account owner will check the destination's explanation and link. The business will group the reasons enquiries were unsuitable. Review the same metrics in the next equivalent period. Because clicks, sessions and enquiries come from different systems, do not present the rows as a funnel of individually matched people.
When adapting the template, put account and period details at the top, source files in an appendix, and an action owner and review date at the end. You can maintain numbers in Excel or Google Sheets and share commentary in a PDF or presentation. For commercial calculations, use the ROAS calculation and its distinction from ROI; revenue is not profit.
Which Tool and Reporting Frequency Should You Use?
Platform exports and a spreadsheet may be sufficient for a few accounts. When repeated collection becomes burdensome, consider connecting GA4 to Data Studio. Formerly called Looker Studio, the product has a no-cost individual edition and a separate Pro edition, as explained in Google's naming announcement. Social network connectors may cost extra, and a GA4 connection does not retrieve all in-platform interactions.
A short weekly check may catch problems in an active campaign; a monthly review may help reassess topics and resources. Choose the interval around the decision you need to make. Put the main result and action on the first page, but do not remove necessary channel detail merely to fit a page limit. If AI helps draft commentary, verify the calculations, scope and causal claims yourself.
Carry the next action back into the content calendar. For a creator partnership, compare equivalent periods and agreed deliverables; the use of dated evidence in an influencer portfolio explains why that context matters. A report is finished when it identifies a task someone can carry out and review.