A sales funnel is a model for understanding and measuring the stages between recognizing a need and making a purchase. To build one, define the outcome first, then the observable steps that lead to it. Count progress consistently at each step. The point is to find unanswered questions or obstacles, not to force every buyer along an identical path.
Viewing a product is not paying for it. Submitting a service enquiry is not signing a contract. Before reporting a “conversion,” name the action you counted. A useful funnel makes these differences visible.
Sales Funnel Stages: TOFU, MOFU and BOFU
The top concerns discovery, the middle concerns evaluation, and the bottom concerns the decision and transaction. TOFU, MOFU and BOFU abbreviate those three sections. The four-part AIDA model uses attention, interest, desire and action instead. There is no mandatory stage count; different funnel models describe the process at different levels of detail.
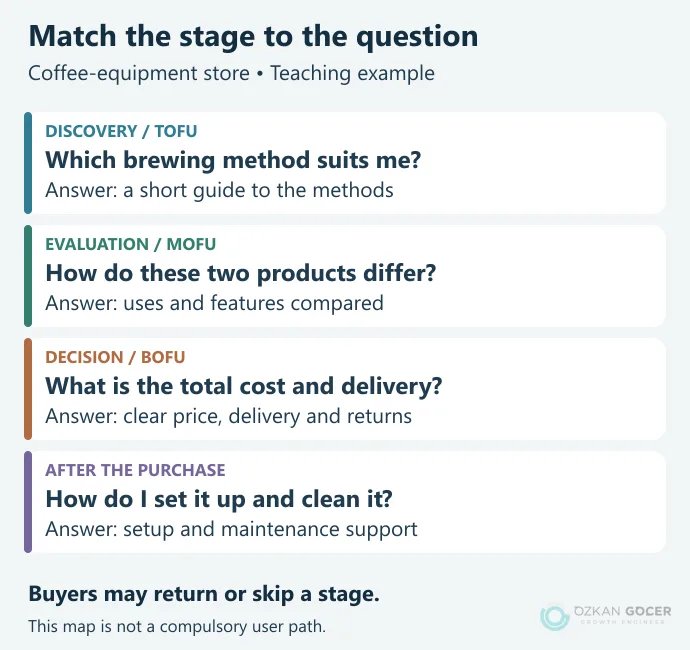
In a coffee-equipment store, someone might learn which brewing method suits them, compare two products, then check delivery terms before ordering. Setup and maintenance support remain part of the relationship after the purchase.
Real journeys need not move in a straight line. A buyer can return to a comparison, change devices or arrive through a product-name search. Researching buyer questions and decision barriers is more useful than imposing the same sequence on everyone.
Sales Funnel vs Marketing Funnel vs Pipeline
Scroll sideways to read every column. Keyboard: focus the table and use the arrow keys.
| Concept | Question | Example record |
|---|---|---|
| Marketing funnel | How do relevant people discover us and start evaluating? | Guide readers and relevant signups |
| Sales funnel | How do they progress toward purchasing? | Evaluation, proposal and purchase |
| Sales pipeline | What should the sales team do with each opportunity? | Meeting booked, proposal sent, contract pending |
Organizations draw the marketing-to-sales boundary differently. Write down what counts as a sales-ready lead in your team. Salesforce’s pipeline explanation focuses on opportunity status and the seller’s next action. A list of open deals and a funnel conversion rate are not interchangeable, even when they use related data.
Build a Funnel Around Your Actual Process
- Select a product or service. Combining the whole business can hide different buying processes.
- Define the outcome. A paid order, a valid enquiry and a signed contract are different events.
- Name observable steps. Ecommerce might use product view, add to cart, begin checkout and purchase.
- Assign a customer question to each step. Does it fit my needs? What is the total cost? When will it arrive?
- Fix the measurement rules. Record the period, counting unit, sequence and allowed time between steps.
- Check the data and the process first. Confirm that an actual completed action produces the intended record before interpreting rates.
Social media content can introduce a topic during discovery. Content built around a specific need can support evaluation, while a suitable email campaign can follow up with subscribers. Each stage does not require its own application or advertising campaign.
Calculate Conversion with a Named Denominator
Step conversion = people reaching the next step ÷ people at the current step × 100. Overall conversion divides the final outcome by the starting group. The numbers below are illustrative, not client results or industry benchmarks.
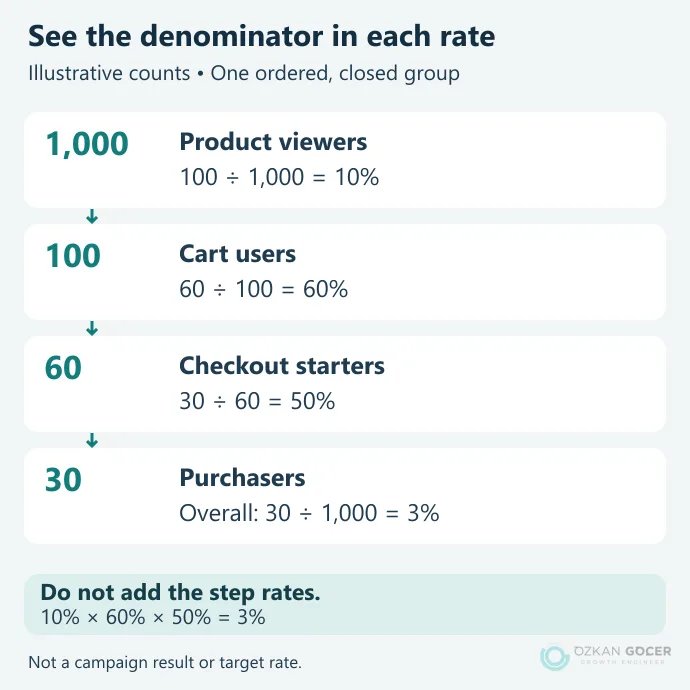
If 100 of 1,000 people add to cart, the first step converts at 10%. If 60 of those 100 begin checkout, the next step converts at 60%. If 30 of those 60 buy, the final step converts at 50%. Overall, 30 ÷ 1,000 = 3%. Do not add the step rates: for this same ordered, closed group, 0.10 × 0.60 × 0.50 = 0.03.
GA4’s funnel report shows the share that does not continue as abandonment. From checkout to purchase in this example, it is (60 − 30) ÷ 60 = 50%. Mixing sessions, people and orders in one denominator changes the question rather than improving the calculation.
Two Starting Templates: Ecommerce and Services
Scroll sideways to read every column. Keyboard: focus the table and use the arrow keys.
| Field | Ecommerce | Service business |
|---|---|---|
| Entry | Person viewing the selected product group | Relevant prospect reviewing the service |
| Intermediate steps | Add to cart → begin checkout | Valid enquiry → meeting → proposal |
| Outcome | Verified purchase | Signed engagement / accepted proposal |
| Source | Analytics + order records | Analytics + forms + CRM / sales records |
| Check | Duplicates, cancellations and refunds | Spam, qualification and time to close |
Five sales from twenty forms do not prove that fifteen prospects were lost because of page design. Some may be outside your scope, awaiting a proposal or buying in a later reporting period. Keep permission for marketing messages separate from the act of making an enquiry.
What Matters When Measuring a Funnel in GA4?
GA4 Funnel exploration distinguishes open and closed funnels. An open funnel allows entry at a later step; a closed funnel requires the starting step. Sequence and timing conditions also affect the result. Do not carry the example’s 3% calculation straight into a report with different entry rules.
Ecommerce can use recommended events such as view_item, add_to_cart, begin_checkout and purchase; generate_lead can represent an enquiry. Check the event definitions. Naming events is not evidence that they are installed correctly. Verify a completed form and a purchase record. If the setup is incomplete, work through the GA4 stream and event checks first.
Consent choices, device changes, blocked tags and duplicate records can affect the observed journey. A purchase missing from analytics has not necessarily disappeared: compare it with order or CRM records. Reports with different periods or user scopes should not be expected to match exactly.
Choose the First Improvement from Evidence
The largest drop-off percentage is not automatically the highest priority. A broken payment button deserves immediate attention; people leaving a discovery article may simply have no need for the product. Consider affected volume, the evidence for a problem, likely impact and the effort required.
- Visits without progress: check traffic intent, the offer and whether tracking works.
- Carts without checkout: inspect total costs, delivery information and account requirements.
- Checkout without orders: inspect payment errors and actual order records.
- Forms without suitable prospects: inspect service scope, form questions and sales qualification.
If the invitation and next action disagree, review the landing page’s message and form together. Higher revenue can coexist with higher costs or refunds, so also consider the distinction between revenue and profit. Use a defined reporting window and a suitable comparison. An uncontrolled before-and-after change is not proof that your edit caused the result.