- |
- ·
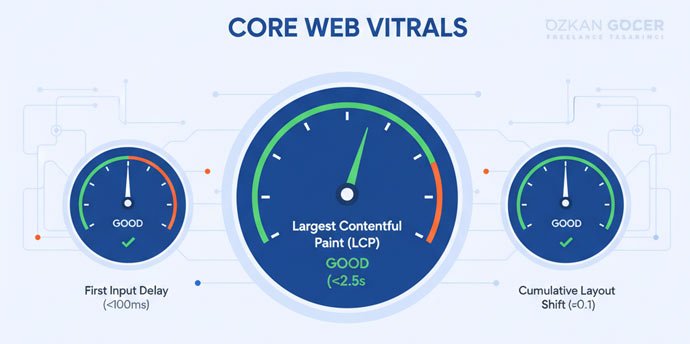
Google measures real-world user experience through three specific metrics known as Core Web Vitals: LCP (Largest Contentful Paint, loading speed), INP (Interaction to Next Paint, responsiveness), and CLS (Cumulative Layout Shift, visual stability). Meeting the 2026 "good" performance thresholds requires keeping LCP under 2.5 seconds, INP under 200 milliseconds, and CLS under 0.1. Google replaced the legacy FID metric with INP in March 2024. Page Experience ranking signals rely on these measurements, which directly influence conversion rates.
My work in web performance spans over 15 years. When Google announced Core Web Vitals in 2020, I remember diagnosing a 6-second LCP on an e-commerce client's site. It was stressful. In the projects I have managed since then, I have pushed dozens of sites past a Lighthouse score of 90. I compiled these insights because most online resources still focus on FID, which Google retired in 2024, while completely ignoring INP. Below, I break down all three metrics with current thresholds and share field-tested optimization techniques alongside practical code examples.
What Are Core Web Vitals and Why Do They Matter?
Google introduced Core Web Vitals in 2020 to standardize how we measure user experience on a web page. The framework translates the abstract concept of speed into three measurable signals: loading performance via Largest Contentful Paint (LCP), interactivity via Interaction to Next Paint (INP), and visual stability via Cumulative Layout Shift (CLS). Chrome user data, known as field data, determines the final metrics instead of synthetic lab tests.
Two distinct areas drive the need for optimization. First, search engine optimization: Core Web Vitals have influenced Google's Page Experience ranking signal since 2021. When two competing pages offer identical content quality, technical performance breaks the tie. Second, conversion rates suffer on slow sites. Google research shows that reducing LCP below 2.5 seconds decreases bounce probability by 24%. High latency kills checkout conversions.
Mobile responsiveness underpins your entire page experience. In my responsive design guide, I explained how a mobile-first layout directly improves Core Web Vitals. I always prioritize mobile-first layouts in my own practice to prevent layout shifts.
The Three Core Web Vitals Metrics (2026)
Google evaluates your site across three distinct user experience dimensions. Passing requires a "good" rating in every single category. One weak score fails the entire page. Speed alone is not enough.
LCP (Largest Contentful Paint): Loading Speed
Largest Contentful Paint (LCP) tracks the render time of the largest visible element, which is typically a hero image, video poster, or main text block. It indicates when visitors actually perceive your page as loaded. Aim for a score under 2.5 seconds, as anything exceeding 4 seconds triggers a poor rating. In my own practice, I usually find that unoptimized images and sluggish servers cause most LCP failures. Fix those first.
INP (Interaction to Next Paint): Responsiveness
Interaction to Next Paint (INP) calculates the visual delay following user actions like clicks, taps, or keystrokes. The metric monitors every interaction during a visit and highlights the slowest response. Keep the delay under 200 milliseconds, because scores above 500ms indicate poor performance. Heavy JavaScript execution blocking the main thread typically drives high delays. Optimize your scripts.
CLS (Cumulative Layout Shift): Visual Stability
Cumulative Layout Shift (CLS) quantifies unexpected movement on the screen during page loads. Common triggers include undimensioned images pushing text downward or delayed advertisements shifting your layout. You want a score under 0.1. Anything above 0.25 is poor. Calculations rely on a unitless score combining the affected viewport area and the movement distance. Keep it stable.
Why FID Was Replaced by INP (March 2024)
Prior to March 2024, Google used First Input Delay (FID) to track responsiveness. It only measured the very first user interaction, which allowed most websites to pass without effort. Google retired FID because INP tracks every single interaction during a session, offering a realistic view of responsiveness. In the projects I have managed, switching focus to INP revealed hidden bottlenecks. Disregard guides still focusing on FID. They are obsolete.
Core Web Vitals Thresholds (2026)
Google categorizes user experience into three distinct performance bands. Passing the assessment requires at least 75% of your actual user visits to hit the target metrics. I monitor field data directly through real user databases to isolate bottlenecks.
| Metric | Good | Needs Improvement | Poor | What It Measures |
|---|---|---|---|---|
| LCP | ≤ 2.5 s | 2.5 - 4.0 s | > 4.0 s | Loading speed |
| INP | ≤ 200 ms | 200 - 500 ms | > 500 ms | Responsiveness |
| CLS | ≤ 0.1 | 0.1 - 0.25 | > 0.25 | Visual stability |
Search engines evaluate mobile and desktop performance on separate tracks. Mobile-first indexing dictates that mobile metrics determine your search visibility. In my own practice, I often see sites with flawless desktop scores lose organic traffic because their mobile layout triggers layout shifts. Optimize for the phone first.
How to Measure Core Web Vitals
Lab Data or Field Data?
Many developers fail to distinguish between the two data sources. Field data reflects actual user experiences, gathered through the Chrome User Experience Report (CrUX) over a rolling 28-day cycle to determine search rankings. Conversely, Lab data runs a single simulation in a controlled environment like Lighthouse, offering immediate metrics that exclude actual user behavior. Interaction to Next Paint (INP) requires real user interaction, making it invisible in lab environments. Build with lab tests; validate with field metrics.
PageSpeed Insights
Using PageSpeed Insights aggregates both datasets on one dashboard. Inputting a URL generates mobile and desktop performance reports, placing CrUX field metrics at the top and Lighthouse lab diagnostics underneath. Start your optimization journey here.
Google Search Console CWV Report
In the projects I have managed, the Core Web Vitals report in Search Console serves as the primary diagnostic tool for site-wide issues. Grouping URLs with similar templates helps you identify systemic template errors instead of auditing pages individually. Relying on field data guarantees you address actual user bottlenecks. Focus on patterns first.
Chrome DevTools and Lighthouse
Pressing F12 in Chrome opens the developer panel where the Lighthouse tab runs instant, isolated page audits. You can isolate INP issues manually in the Performance panel by recording a user interaction and inspecting the timeline for long tasks. Local testing confirms whether your code changes solved the issue before deployment.
How to Improve LCP
Three variables dictate your LCP: server response times, resource load times, and render-blocking elements. In my own practice, I have found that optimizing images yields 70% of the total LCP improvement. Speed follows efficiency.
Image Optimization
Convert your hero image to WebP or AVIF to reduce file size by 30-50% compared to JPEGs. Serve multiple resolutions using the srcset attribute, and apply fetchpriority="high" to the critical image element.
<img src="hero.webp" fetchpriority="high" decoding="async"
     width="1200" height="630" alt="...">
Serving a 3MB JPEG hero image will push your LCP past 4 seconds. In the projects I have managed, I solved image bloat by building a structured delivery pipeline, which I detailed in my guide on the web design process.
Server Response (TTFB) and CDN
A Time to First Byte (TTFB) exceeding 600ms ruins your chances of a fast LCP. You can fix slow response times by using high-performance hosting, server-level caching like Redis or Varnish, and a CDN such as Cloudflare for static assets. Distant users will see TTFB cut in half.
Eliminate Render-Blocking Resources
Synchronous CSS and JavaScript in the document head delay page rendering. Inline your critical CSS, load the remaining styles asynchronously, and apply defer or async attributes to your scripts. Delay third-party scripts like analytics or chat widgets until the main page finishes rendering.
How to Improve INP
In my own practice optimizing Core Web Vitals, Interaction to Next Paint (INP) consistently proves to be the hardest metric to fix on JavaScript-heavy websites. The culprit is almost always a clogged main thread. Long execution tasks block user inputs. Fix the thread, fix the metric.
Reduce JavaScript Execution
Start by opening the Chrome Coverage tab to identify and purge unused code. You should implement code splitting to load only the exact scripts each page requires, while auditing your third-party integrations. In the projects I have managed, a single unoptimized A/B testing or analytics script frequently pushes INP past 300ms. Cut the bloat.
Break Up Long Tasks
Browsers classify any script execution exceeding 50 milliseconds as a long task that freezes the user interface. You can eliminate the lag by breaking heavy operations into smaller chunks, allowing the main thread to process inputs via scheduler.yield() or setTimeout:
async function heavyWork(data) {
  for (const chunk of data) {
    process(chunk);
    await scheduler.yield();
  }
}
How to Improve CLS
In my own practice, fixing Cumulative Layout Shift (CLS) issues yields the fastest speed gains because the core problem is straightforward: elements lack reserved space on the viewport. Fix the layout gaps.
Set Dimensions on Media
Define explicit width and height attributes directly on every <img> and <video> tag. Browsers calculate the aspect ratio immediately to allocate the correct space before the asset downloads. Alternatively, write the CSS aspect-ratio property. It works.
Font Loading (FOUT/FOIT) Management
Slow-loading web fonts trigger Flash of Invisible Text (FOIT) or Flash of Unstyled Text (FOUT). The sudden font swap shifts your layout. Solve the issue by applying font-display: optional and preloading critical font files with <link rel="preload">. I detailed the technical execution of typeface selection in my typography guide.
Dynamic Content Placement
Late-arriving ads, third-party embeds, or notification banners push existing content downward and spike your CLS metric. Avoid layout shifts by reserving a fixed container space using CSS properties like min-height to hold the gap before the script loads. If you do not know the exact ad height, reserve space based on the historical average size.
Core Web Vitals for WordPress and E-Commerce Sites
WordPress runs fast out of the box; speed drops when you pile on bloated themes and plugins. In my own practice, I regularly audit client sites running over 25 plugins, only to find half of them sitting completely idle. Clean code wins. You can fix the lag by purging unused tools and installing WP Rocket or LiteSpeed Cache to automate critical CSS generation, lazy loading, and JavaScript deferral. Swap heavy page-builders for lightweight frameworks like GeneratePress or Kadence to shave seconds off your load times. On e-commerce stores, product images create the heaviest payload, which requires bulk WebP conversion and delayed image loading. You can study the technical specifications for each speed metric directly through Google's official web.dev Core Web Vitals resource.
Are Core Web Vitals Important for SEO?
Google prioritizes content quality over page speed, making Core Web Vitals (CWV) secondary ranking signals. In the projects I have managed, speed functions primarily as a tie-breaker when two competing pages offer equal value under mobile-first indexing. Bad scores rarely destroy your search positions overnight. Good scores win. They provide a small, steady advantage that tips the scale for highly competitive keywords. I analyzed the complete ranking framework in my backlink and SEO guide, while the MDN Web Performance documentation provides the technical specifications for these metrics.
Common Core Web Vitals Mistakes
- Fixating on lab data while ignoring field data: I often see developers celebrate a 95 score on Lighthouse while real users suffer. Google uses actual Chrome User Experience Report (CrUX) field data to rank your site, making simulated lab tests secondary. Fix the real-world speed.
- Ignoring INP: Focusing only on the retired First Input Delay (FID) metric leaves your site vulnerable. Interaction to Next Paint (INP) measures delay across the entire user visit with much stricter criteria.
- Lazy-loading the hero image: Applying
loading="lazy"to above-the-fold elements delays your Largest Contentful Paint (LCP). Hero images need immediate loading and high fetch priority to render fast. - Omitting image dimensions: Uploading images without explicit width and height attributes triggers layout shifts. Browsers cannot reserve space, causing Cumulative Layout Shift (CLS) issues. Define the dimensions.
- Piling on third-party scripts: Loading chat widgets, analytics, and A/B testing tools without strict oversight blocks the main thread. In the projects I have managed, unoptimized scripts are the primary cause of poor INP. Audit them regularly.
- Treating optimization as a one-off task: Performance metrics fluctuate constantly. Google calculates Core Web Vitals using a rolling 28-day window, which demands continuous monitoring instead of a single audit. Keep tracking.
2026 and Beyond: The Future of CWV
In the projects I have managed, I build for adaptability because Google constantly shifts its performance benchmarks. Interaction to Next Paint (INP) replaced First Input Delay (FID) in 2024, and future updates will likely target animation smoothness or scroll performance. Modern optimization focuses on tracking single-page applications (SPAs) via Soft Navigation support, diagnosing INP issues with the Long Animation Frames (LoAF) API, and cutting Largest Contentful Paint (LCP) times using server-side rendering (SSR) and edge computing. Clean architecture survives updates. You will not panic.
Fixing your scores requires a systematic approach. Start by analyzing mobile field data in PageSpeed Insights, then isolate your lowest score for immediate optimization. In my own practice, I pull Chrome User Experience Report (CrUX) data first to pinpoint exactly which metric lands in the "poor" category. Apply the technical fixes outlined in this guide. Run the tests again after the 28-day data cycle completes to verify your progress.
Frequently Asked Questions
Quick answers for readers who skipped to the end.
What are Core Web Vitals?
What are the three Core Web Vitals?
What is a good Core Web Vitals score?
What is LCP and how do I improve it?
What is INP and how is it different from FID?
What is CLS and how do I reduce it?
How are Core Web Vitals measured?
What is the difference between lab data and field data?
Are Core Web Vitals important for SEO?
How do I improve Core Web Vitals on WordPress?
Why was FID removed?
How often are Core Web Vitals updated?
My Lighthouse score is 90 but Search Console says poor, why?
My INP is high, what is the main cause?
Why are mobile and desktop Core Web Vitals scores different?
How long does a Core Web Vitals improvement take to show results?